Flow API
The flow API is used when logging surrounds an execution flow. This is a good fit when you want tracing or domain-oriented observability.
You can access the flow logger from Blindsight using logger.flow:
import com.tersesystems.blindsight._
import com.tersesystems.blindsight.flow._

val logger = LoggerFactory.getLogger
val flowLogger: FlowLogger = logger.flow
Usage
What happens in a flow is determined by the FlowBehavior. Implementing a flow behavior comes down to creating Markers and Statement for entry, exit, and exceptions.
There are two out of the box behaviors provided: SimpleFlowBehavior and XLoggerFlowBehavior. These are modelled after pos and XLogger, respectively.
For example, to add XLoggerFlowBehavior
import com.tersesystems.blindsight.flow.XLoggerFlowBehavior

trait LoggingTraits {
  implicit def flowBehavior[B: ToArgument]: FlowBehavior[B] = new XLoggerFlowBehavior()
}
Once you have a flow behavior in scope, the flow logger takes a block of execution, and returns the result transparently, according to the log level.
sourcedef flowMethod(arg1: Int, arg2: Int): Int =
flowLogger.trace {
arg1 + arg2
}
The result should have a type class instance of ToArgument, so that it can be considered in logging. For example, if the return type is Person, then you must have a ToArguments[Person] in scope:
sourcedef personFlowMethod(arg1: Int, arg2: Int): Person =
flowLogger.trace {
Person(name = "Will", age = arg1 + arg2)
}
case class Person(name: String, age: Int)
object Person {
implicit val personToArguments: ToArgument[Person] = ToArgument { person =>
import com.tersesystems.blindsight.AST._
import com.tersesystems.blindsight.DSL._
val personObj: BObject = "person" -> (
("name" -> person.name) ~ ("age" -> person.age)
)
Argument(personObj)
}
}
If logging is enabled, then the execution is wrapped to capture the result or execution, and then the result is returned or execution rethrown. If the logging is not enabled (whether through conditional logging, explicit filtering, or threshold), then execution of the block still proceeds but is not wrapped by a Try block.
The flow is safe to use with withCondition. If disabled, the logger will short circuit to executing the block without adding any logging:
private def flowEnabled: Condition = Condition.never
private val logger = LoggerFactory.getLogger
private val flowLogger: FlowLogger = logger.flow.withCondition(flowEnabled)
To disable flow logging where it would normally be logged, use Condition.never in the withCondition or when block. Using Condition.never allows the flow to short-circuit with no-op behavior.
Duration
You can render durations in a flow logger by adding logback-tracing, which will keep track of various spans for you.
- sbt
libraryDependencies += "com.tersesystems.logback" % "logback-tracing" % "latest.version"- Maven
<dependencies> <dependency> <groupId>com.tersesystems.logback</groupId> <artifactId>logback-tracing</artifactId> <version>latest.version</version> </dependency> </dependencies>- Gradle
dependencies {
  implementation "com.tersesystems.logback:logback-tracing:latest.version"
}
The span.duration() will return how long the span took to execute. The honeycomb integration mentioned below is a complete implementation, but for example you can do something like this:
class DurationFlowBehavior[B: ToArgument](implicit spanInfo: SpanInfo) extends FlowBehavior[B] {

  // ...

  override def exitStatement(resultValue: B, source: Source): Option[Statement] =
    Some {
      val span = popCurrentSpan
      Statement()
        .withMarkers(Markers(markerFactory(span)))
        .withMessage(s"${source.enclosing.value} exit, duration ${span.duration()}")
        .withArguments(Arguments(resultValue))
    }
}
Integration
Flow based logging, because it leaves the flow behavior open, is a good way to integrate with third party systems.
Instrumentation
Flow based logging works when you can add lines to the source and recompile, but in some situations you may have library or utility code, where you don’t have access to the source code. In this case, you can instrument the code at run time for logging entry and exit, using terse-logback instrumentation.
This works even on code in the Java standard libraries, and can be extremely useful when exceptions are swallowed or spawn threads with no exception handler:
logback.bytebuddy {
  service-name = "example-service"
  tracing {
    "java.lang.Thread" = [
      "run"
    ]
    "javax.net.ssl.SSLContext" = ["*"]
  }
}
See the logging-instrumentation-example for an example.
Opentracing
While it’s possible to set up an Opentracing FlowBehavior that creates spans directly, spans will not show up in the logs (which is confusing) and will tightly couple the Opentracing instrumentation with your logging (which may lead to bugs).
What you can do instead is inject your logs into an active span inside of a flow, using the standard log fields:
ActiveSpan span = ...
span.log(ImmutableMap.of("message", message));
span.log(ImmutableMap.of("error.kind", throwable.getClass().getName()));
span.log(ImmutableMap.of("error.object", throwable));
Datadog
You can connect your logs to Datadog traces using the Correlation Identifier using dd.trace_id and dd.span_id respectively:
import datadog.trace.api.CorrelationIdentifier._

val datadogTraceId = Markers("dd.trace_id" -> Option(getTraceId).getOrElse("0"))
val datadogSpanId = Markers("dd.span_id" -> Option(getSpanId).getOrElse("0"))
Honeycomb
If you integrate with logback-tracing, then you can also log to Honeycomb using a FlowBehavior.
and the following dependencies:
- sbt
libraryDependencies += "com.tersesystems.logback" % "logback-tracing" % "latest.version"- Maven
<dependencies> <dependency> <groupId>com.tersesystems.logback</groupId> <artifactId>logback-tracing</artifactId> <version>latest.version</version> </dependency> </dependencies>- Gradle
dependencies {
  implementation "com.tersesystems.logback:logback-tracing:latest.version"
}
- sbt
libraryDependencies += "com.tersesystems.logback" % "logback-uniqueid-appender" % "latest.version"- Maven
<dependencies> <dependency> <groupId>com.tersesystems.logback</groupId> <artifactId>logback-uniqueid-appender</artifactId> <version>latest.version</version> </dependency> </dependencies>- Gradle
dependencies {
  implementation "com.tersesystems.logback:logback-uniqueid-appender:latest.version"
}
See play-blindsight for a worked example.
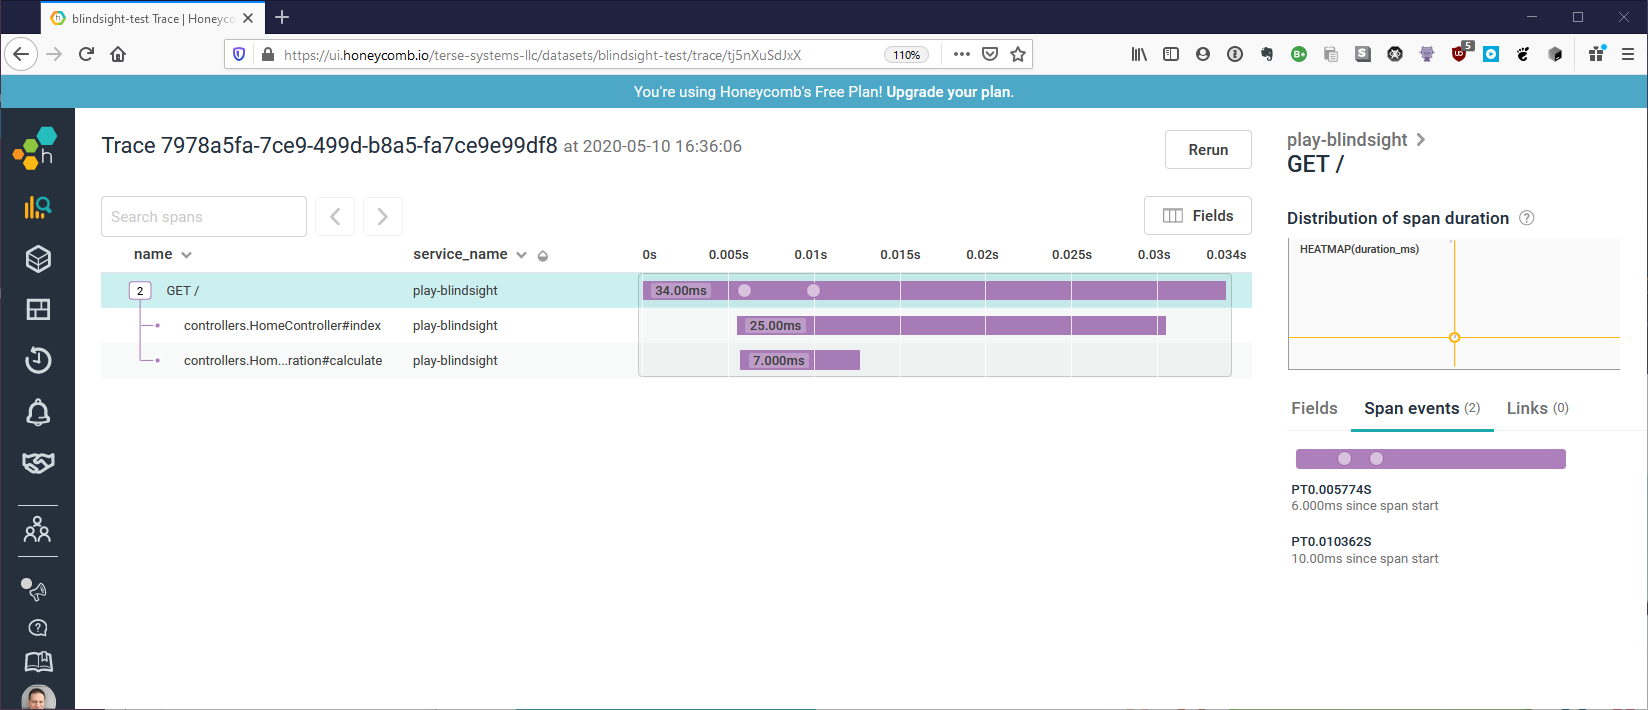
You can produce Honeycomb manual traces with the following:
sourceobject HoneycombFlow {
private val logger = LoggerFactory.getLogger
private val idgen = new RandomUUIDIdGenerator
private val builder: SpanInfo.Builder = {
SpanInfo
.builder()
.setServiceName("blindsight-example")
}
implicit def flowMapping[B: ToArgument](implicit
spanInfo: SpanInfo
): HoneycombFlowBehavior[B] = {
new HoneycombFlowBehavior[B]
}
def main(args: Array[String]): Unit = {
generateRootSpan { implicit rootSpan =>
val intResult = flowMethod(1, 2)
val personResult = personFlowMethod(1, 2)
}
}
def flowMethod(arg1: Int, arg2: Int)(implicit spanInfo: SpanInfo): Int = {
logger.flow.info {
arg1 + arg2
}
}
def personFlowMethod(arg1: Int, arg2: Int)(implicit spanInfo: SpanInfo): Person = {
logger.flow.info {
Person(name = "Will", age = arg1 + arg2)
}
}
private def generateRootSpan[T](block: SpanInfo => T)(implicit enclosing: Enclosing): T = {
val rootSpan =
builder.setRootSpan(asJavaSupplier(() => idgen.generateId()), enclosing.value).buildNow
try {
block(rootSpan)
} finally {
// The root span has to be logged _last_, after the child spans.
logger.info(
Markers(HoneycombFlowBehavior.markerFactory(rootSpan)),
s"${enclosing.value} exit, duration ${rootSpan.duration()}"
)
}
}
case class Person(name: String, age: Int)
object Person {
implicit val personToArguments: ToArgument[Person] = ToArgument { person =>
import com.tersesystems.blindsight.AST._
import com.tersesystems.blindsight.DSL._
val personObj: BObject = "person" -> (
("name" -> person.name) ~ ("age" -> person.age)
)
Argument(personObj)
}
}
}
class HoneycombFlowBehavior[B: ToArgument](implicit spanInfo: SpanInfo) extends FlowBehavior[B] {
import HoneycombFlowBehavior.markerFactory
// Create a thread local stack of span info.
private val threadLocalStack: ThreadLocal[mutable.Stack[SpanInfo]] = {
val local: ThreadLocal[mutable.Stack[SpanInfo]] = new ThreadLocal()
local.set(mutable.Stack[SpanInfo]())
local
}
override def entryStatement(source: Source): Option[Statement] = {
// Start a child span, and push it onto the stack
spanInfo.withChild(source.enclosing.value, asJavaFunction(pushCurrentSpan))
None
}
override def throwingStatement(throwable: Throwable, source: Source): Option[(Level, Statement)] =
Some {
(
Level.ERROR,
Statement()
.withThrowable(throwable)
.withMarkers(Markers(markerFactory(popCurrentSpan)))
.withMessage(s"${source.enclosing.value} exception")
)
}
override def exitStatement(resultValue: B, source: Source): Option[Statement] =
Some {
val span = popCurrentSpan
Statement()
.withMarkers(Markers(markerFactory(span)))
.withMessage(s"${source.enclosing.value} exit, duration ${span.duration()}")
.withArguments(Arguments(resultValue))
}
private def pushCurrentSpan(spanInfo: SpanInfo): Unit = threadLocalStack.get.push(spanInfo)
private def popCurrentSpan: SpanInfo = threadLocalStack.get().pop()
}
object HoneycombFlowBehavior {
val markerFactory = new SpanMarkerFactory
}
Performance
Performance of flow logging is evaluated with a set of JMH benchmarks, using Logback with a no-op appender and FlowBehavior.noop, so only the raw CPU cost of branching and constructing statements is evaluated.
On an i9-9990k, the results are as follows:
[info] Benchmark                 Mode  Cnt    Score    Error  Units
[info] FlowBenchmark.info        avgt    5  533.628 ± 51.956  ns/op
[info] FlowBenchmark.infoWhen    avgt    5   43.804 ±  1.139  ns/op
[info] FlowBenchmark.neverInfo   avgt    5   38.950 ±  0.278  ns/op
[info] FlowBenchmark.neverTrace  avgt    5   39.042 ±  0.659  ns/op
[info] FlowBenchmark.trace       avgt    5   44.315 ±  1.513  ns/op
[info] FlowBenchmark.traceWhen   avgt    5   42.634 ±  1.379  ns/op
Evaluation of a no-op flow adds roughly 42 nanoseconds to execution – the time it takes to create a Seq from sourcecode.Args and discard them. Removing sourcecode.Args from the implicits takes the no-op down to 4.5 nanoseconds. For comparison, evaluating a guard of if (logger.isLoggingDebug()) using SLF4J is 1.5 nanoseconds. I believe this is an acceptable cost for tracing, but please file an issue if it is a concern.